

Can a free, easy-to-use tool really tell you if an idea will sell? That question matters when you plan a launch. We believe clarity comes from clear data and quick analysis. This intro shows how the right signals help you decide.
Google Trends gives a random sample of aggregated, anonymized searches across web and video. It is a simple tool to check search interest and rising topics over time.
Whether you are starting a small business or refining product ideas, you can use this free resource to spot opportunities. We will show you how to read search volume, compare queries, and spot top categories that matter.
By the end, you’ll know how to turn quick analysis into action—so you stop guessing and start launching with more confidence.
Key Takeaways
- Use google trends to view search interest and rising topics fast.
- Compare related search terms to judge demand and opportunities.
- Look at time-based data to spot seasonal or growing interest.
- Focus on simple analysis to save time and cut costs.
- Turn insights into better product and content ideas.
Understanding the Value of Google Trends Market Research
Search activity acts like a pulse — it tells you if interest in a topic is rising, static, or falling.
Sequoyah Glenn, Principal Consultant at 924 CoOperative, notes that google trends is an amazing tool for businesses to understand topics people are actively engaging in.

Use this tool to track the popularity of specific search terms over time and across regions. The results show directional data — patterns rather than exact search volume.
That direction helps you spot early opportunities. You can identify rising topics and decide where to focus product effort or marketing spend.
- Monitor queries to gauge consumer curiosity.
- Cross-check with other analytics (like GA4) to avoid a simple data dump.
- Use trends to reduce risk and refine product timing.
“This tool reveals what people are curious about — and that insight lets teams act sooner.”
In short: treat the platform as a directional signal. Combine it with other sources, and you get clearer, faster analysis for smarter business decisions.
Setting Up Your Initial Research Strategy
Good research starts with clear, repeatable steps. Pick 2–3 search terms and let the explore view reveal which ones show steady or rising interest. This gives a quick signal you can act on.

Using the Explore Tool
Use the Explore tool to pull custom terms and compare them over time. Apply filters for country, date range, and category to focus your view.
Leave the search box empty to surface top terms in a category. That shows rising topics and top pages without bias.
Navigating Trending Topics
The Trending Now panel gives a snapshot of what people are searching today. It pairs approximate search volume with related news so you get context.
- Compare brands (for example, “Sol de Janeiro” vs “Rare Beauty”) to see regional swings.
- Scan related topics and queries cards to expand your keyword list and spot less competitive ideas.
- Remember: topics aggregate variations, misspellings, and acronyms—so you capture broader interest.
“Start simple, test often, and let directional data guide your next content and product moves.”
Analyzing Competitor Performance and Brand Awareness
Track how people notice your brand — and how you stack up against rivals.
Track search activity for your brand and competitors to see who wins attention during campaigns. Aided awareness is simple: directly enter your brand name in the explore view and watch search volume over time.
Unaided awareness is different. Check the “Trending Now” panel to see if your brand or industry topics appear without a direct search. That shows organic buzz.

Measuring Aided and Unaided Awareness
Use both signals together. Compare your search term patterns with competitors to spot shifts after a launch or ad push.
- Monitor name searches to track long-term brand volume and campaign impact.
- Scan related topics and queries to learn what people search alongside your brand.
- Download weekly or monthly data to correlate search interest with sales or PR events.
“If people search your brand with words like ‘coupons,’ build a clear content page that answers that need.”
Finally, compare metro-level searches if you sell in multiple regions. That helps prioritize where to focus ads, products, or local content for better results.
Evaluating Product Demand and Consumer Interest
Look up exact product names and features to confirm whether online interest justifies a launch.
Start with a single search term—enter a product name like “Rare Beauty Liquid Touch Weightless Foundation” and change the time range to spot recent upticks in search interest.
Do the same for category-level items. For example, check dog probiotics to see long-term growth and which states show high volume. We found strong interest in Oregon, Arizona, and Colorado.

Use query and related topics cards to expand your list. Track feature terms (ingredients, benefits, size) to know what people value.
Then act on the signals. If search growth is steady, it suggests real demand. If interest spikes briefly, test with a small launch or ad test first.
“Validate demand early—use short tests and local campaigns to confirm regional interest before you scale.”
- Confirm rising searches for specific products or features.
- Identify regions driving growth and tailor offers there.
- Use related queries to find adjacent opportunities and keywords for content.
Identifying Geographical and Seasonal Trends
Pinpoint where demand lives by mapping search activity across cities and seasons.
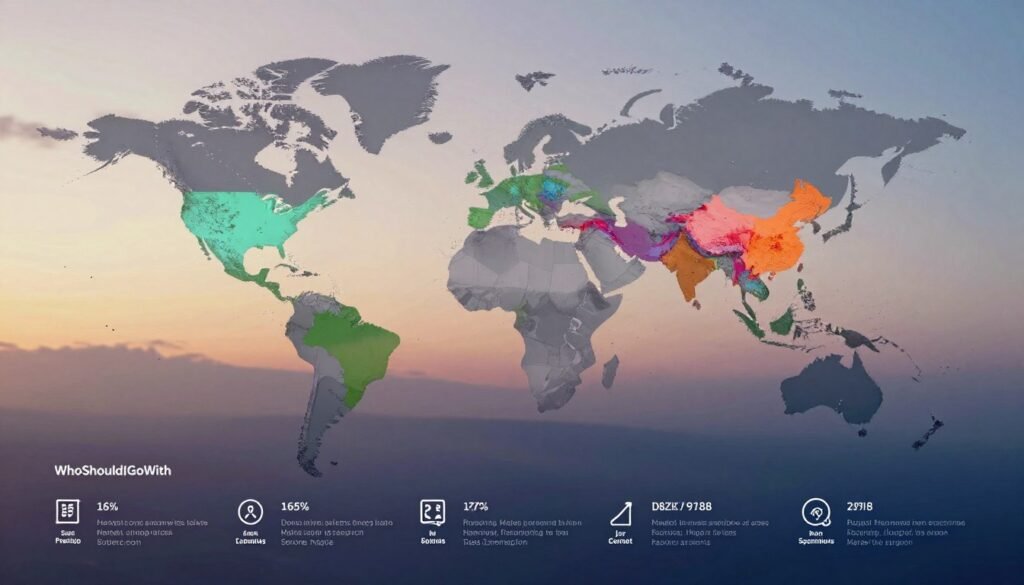
Drilling down into metro areas gives you precise signals. Use the geographic filter to move from country to state to city. That reveals which metros drive rising interest for a term.
For example, search queries for “Protein Ice Cream” or “Fly Fishing” can highlight unexpected hotspots. Running shoes often peak in March–May in states with harsh winters, like Nebraska. These micro-level results help you prioritize ads and inventory.
Planning for seasonal spikes
Seasonal patterns are easy to spot. Traeger grills show clear spikes around Thanksgiving and the Fourth of July. If your product follows a holiday rhythm, plan content and stock ahead.
- Map peaks by year and region to spot repeatable patterns.
- Adjust content calendars so articles and product pages publish before search interest climbs.
- Factor in places like Hawaii, which may show steadier demand and less seasonality.
“Use local and seasonal signals together — they guide timing for campaigns, inventory, and content.”
Integrating Additional Data Sources for Deeper Insights
Pair broad search snapshots with specialized feeds to catch rising topics before they peak.
Start by layering sources. Use google trends for directional search interest. Then add a crawler like Exploding Topics to surface early signals from sites and social feeds.

Exploding Topics provides a REST API that returns near real-time topic growth. That fills gaps where public dashboards update slowly.
- Cross-reference with analytics (like GA4) to validate intent and page performance.
- Use the Trend Database to spot what is “Exploding” or “Peaked” in your category.
- Combine weekly expert reports and newsletters for context and ideas.
“Combine multiple signals—directional search data plus real-time topic feeds—to make smarter launch choices.”
| Source | Strength | Best use |
|---|---|---|
| google trends | Directional search interest | Seasonal timing, term comparisons |
| Exploding Topics | Early signal discovery | Real-time topic mining, API integration |
| GA4 / analytics | On-site behavior | Validate demand and content performance |
Conclusion
, Turn search signals into small, testable bets.
We find that Trends is a fast, free way to spot rising topics and compare terms over time. Use these signals as direction—not exact counts—to shape product pages and content quick tests.
Pair this view with other analytics and user tests. That mix helps you confirm demand, monitor competitors, and refine keywords before you scale.
For a deeper how-to on applying these ideas to smarter planning, see leveraging Google Trends.
Start today: pick a few search terms, run small tests, and iterate on the topic and content that shows real engagement over time.
FAQ
What is the simplest way to use the explore tool before launching a product?
How does this approach help validate product demand?
Which filters should I set first when building an initial research strategy?
How can I use trending topics without chasing every fad?
What’s the best way to measure competitor awareness with search data?
How do I interpret aided versus unaided awareness using search analytics?
How can I evaluate regional demand before choosing launch locations?
What’s the method for planning around seasonal spikes?
When should I bring in other data sources to supplement search insights?
How often should I monitor search interest for an active product?
Ashok Nandi is an author at WhoShouldIGoWith.com, where he writes research-led comparison guides, buyer education articles, industry explainers, and best-of rankings across emerging and competitive markets. His work focuses on helping readers understand complex choices with greater clarity by studying market trends, brand positioning, customer needs, service models, and the factors that separate strong providers from the rest.
At WhoShouldIGoWith.com, Ashok brings a structured, analytical approach to every article. He breaks down crowded markets into simple, useful insights so that readers can compare companies, platforms, products, and service providers with more confidence. His writing is designed to be clear, practical, and decision-focused, making it especially useful for buyers, families, founders, professionals, and business leaders who want to make informed choices without getting lost in vague claims or marketing noise.
Ashok’s articles often combine market research, category analysis, practical buying criteria, and easy-to-follow explanations. Whether he is reviewing learning platforms, business services, technology providers, or consumer-facing solutions, his goal is to help readers understand not just which options stand out, but why they stand out.
Through his work at WhoShouldIGoWith.com, Ashok contributes to the firm’s mission of making high-quality market research easier to access, easier to read, and easier to act on.